Analytics Platform
Access a dynamic library of daily-updated market and economic charts designed for wealth managers who need polished, data-centric visuals ready for client conversations.
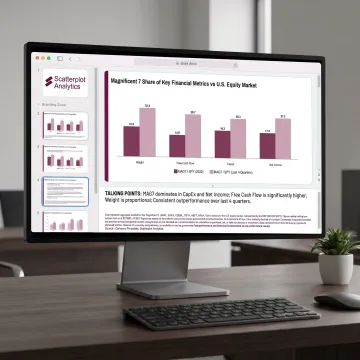
Turn complex market data into clear, client-ready visuals with Scatterplot’s dynamic library of investment charts, branded presentation decks, and guided talking points. Built for wealth managers, financial advisers, and investment professionals, the platform helps reduce prep time, explain market concepts confidently, and keep every client conversation supported by polished, data-driven insights.
Client-ready investment visuals, branded decks, and market insights built to simplify adviser communication.
Access a dynamic library of daily-updated market and economic charts designed for wealth managers who need polished, data-centric visuals ready for client conversations.
Create presentation-ready investment decks customized with your logo, colors, and disclosures, helping every client meeting feel consistent, credible, and on brand.
Read chart-driven market commentary through The Plot, featuring independent research and visual analysis on investment trends, equity markets, and economic themes.

Start with a curated library of expertly crafted market and economic visuals. Charts are designed to make investment concepts easier to explain, giving advisers a stronger foundation for client education and portfolio conversations.
Scatterplot is built to make market communication easier, faster, and more credible.
Market and economic visuals are refreshed regularly using current third-party data sources.
Slides reflect your logo, colors, and disclosures for consistent client-facing presentations.
Designed specifically for wealth managers, financial advisers, and investment professionals.
Guided discussion notes help translate complex market data into client-friendly explanations.
Experienced investment analysis behind every Scatterplot visual.

Founder, Scatterplot
Sanjeev Pati, CFA, is the Founder of Scatterplot Analytics LLC, a platform dedicated to delivering daily-updated, client-ready investment visuals for wealth managers and financial advisers. With a deep background in investment analysis and financial data, Sanjeev built Scatterplot to solve a common challenge facing advisers: the hours spent sourcing market data, building charts, and polishing presentation decks. His expertise in data-driven communication and visual storytelling drives the platform's mission to help investment professionals engage clients with clarity and confidence. Sanjeev's CFA designation reflects his rigorous understanding of financial markets and his commitment to delivering credible, high-quality insights. Through Scatterplot, he empowers advisers to focus on what matters most — meaningful client conversations backed by expertly crafted, fully branded market visuals.
The seven common steps are defining the objective, identifying the target market, collecting relevant data, analyzing competitors, evaluating market trends, interpreting customer or investor behavior, and presenting conclusions clearly. Scatterplot supports the presentation and communication side of analysis by turning market and economic data into branded, client-ready charts with guided talking points.
Talk with our team about branded market visuals and adviser workflows.

Founded by a CFA charterholder.
Investment information developed for adviser communication.
Branded charts designed for client meetings.
Reach out to learn how Scatterplot can help your advisory team create branded, data-driven presentations with less preparation time.
For immediate assistance, feel free to give us a direct call at +1 (914) 354 3363. You can also send us a quick email at support@scatterplot.co.
For immediate assistance, feel free to give us a direct call at +1 (914) 354 3363. You can also send us a quick email at support@scatterplot.co.