Sector Charts
Access visual sector performance charts designed to help advisers explain leadership trends, rotation patterns, and market shifts using clear, data-centric investment visuals.
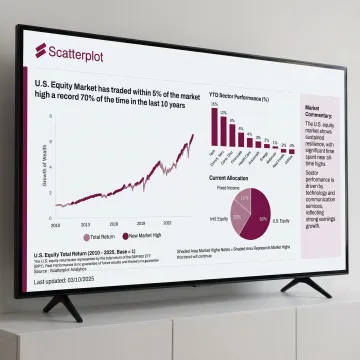
Make sector leadership, rotations, and market concentration easier to explain with Scatterplot’s chart-driven research and daily-updated investment visuals. Built for wealth managers, financial advisers, and investment professionals, this service helps turn complex market data into clear, branded, client-ready conversations without spending hours sourcing data, rebuilding charts, or polishing presentation decks.

Daily-updated visuals, independent research, and branded presentation tools for clearer adviser-client market conversations.
Access visual sector performance charts designed to help advisers explain leadership trends, rotation patterns, and market shifts using clear, data-centric investment visuals.
Read chart-driven insights from The Plot, including independent research on AI infrastructure, equity concentration, diversification, and changing investment leadership.
Create client-ready investment decks with your logo, colors, and disclosures, supported by guided talking points and automatically updated visuals.
Scatterplot helps advisers transform sector performance data and market research into polished, client-ready visuals. Instead of sourcing charts, reformatting slides, and rewriting explanations, users can access daily-updated investment visuals, branded decks, and guided talking points. The result is clearer communication, more consistent presentations, and more time focused on meaningful client conversations.
Scatterplot combines market expertise, visual clarity, and adviser-focused workflow support.
Charts refresh using recent available data, aligned with underlying provider release schedules.
Slides can reflect your logo, colors, disclosures, and presentation style consistently.
Guided discussion notes help advisers explain market insights clearly during client meetings.
Founder Sanjeev Pati, CFA brings rigorous investment analysis and visual storytelling expertise.
Investment expertise behind Scatterplot’s visual research platform.

Founder, Scatterplot
Sanjeev Pati, CFA, is the Founder of Scatterplot Analytics LLC, a platform dedicated to delivering daily-updated, client-ready investment visuals for wealth managers and financial advisers. With a deep background in investment analysis and financial data, Sanjeev built Scatterplot to solve a common challenge facing advisers: the hours spent sourcing market data, building charts, and polishing presentation decks. His expertise in data-driven communication and visual storytelling drives the platform's mission to help investment professionals engage clients with clarity and confidence. Sanjeev's CFA designation reflects his rigorous understanding of financial markets and his commitment to delivering credible, high-quality insights. Through Scatterplot, he empowers advisers to focus on what matters most — meaningful client conversations backed by expertly crafted, fully branded market visuals.
Sector performance charts visually compare how different market sectors are behaving over time. They help advisers explain leadership, rotation, relative strength, and changes in investor preference. Scatterplot’s charts are designed for client conversations, using clear visuals that translate complex market data into easier-to-understand investment context.
Connect with Scatterplot for platform and subscription support.

Founder holds rigorous investment analysis credential.
Investment information built for objective communication.
Charts refreshed with recent available data.
Reach out to Scatterplot for questions about subscriptions, branded decks, chart updates, or using sector performance research in adviser workflows.
For immediate assistance, feel free to give us a direct call at +1 (914) 354 3363. You can also send us a quick email at support@scatterplot.co.
For immediate assistance, feel free to give us a direct call at +1 (914) 354 3363. You can also send us a quick email at support@scatterplot.co.