Missing a clear pattern setup can mean acting too late or not at all. Getting it right means entering a trade with a defined target, a logical stop, and a probability edge. This guide covers both main pattern categories, the key formations within each, and how to apply them with discipline.
Key Takeaways
- Chart patterns are recurring price formations that signal whether a trend will continue or reverse
- Two primary categories: continuation patterns (trend pauses, then resumes) and reversal patterns (trend changes direction)
- Key patterns to know: flags, pennants, triangles, cup and handle, head and shoulders, double tops/bottoms
- No pattern works alone — volume, trend context, and risk management all matter
- For wealth advisers, chart patterns are a practical tool for explaining market behavior and entry/exit decisions to clients
What Are Stock Market Chart Patterns?
Chart patterns are repeating price formations that appear on stock charts as buyers and sellers compete for control. Technical analysts use them to forecast the probable direction of future price moves based on how similar formations have resolved historically.
Markets are driven by human behavior — and human behavior tends to repeat. When traders face uncertainty, they hesitate at the same price levels; when confidence builds, they push through resistance the same way they always have. Patterns are what that behavior looks like on a chart.
That structure gets built from trendlines. Connecting a series of price highs forms a resistance line; connecting lows forms a support line. The interaction between those lines — whether they converge, diverge, or run parallel — defines the shape and meaning of each pattern.
A few principles that apply across all patterns:
- Patterns on higher time frames (daily, weekly) carry more weight than those on intraday charts
- Each trendline needs a minimum of two contact points to be valid
- Patterns become more reliable with more price points touching each line
- Research from Lo, Mamaysky, and Wang found that several technical patterns — including head-and-shoulders and double-bottom formations — carried statistically significant incremental information across a 31-year sample
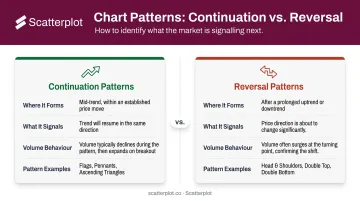
The Two Main Types of Chart Patterns
Every chart pattern falls into one of two categories, and knowing which you're looking at determines how you act on it.
Continuation patterns form mid-trend when the market consolidates before resuming its original direction. The market is pausing, not reversing. The longer and more defined the consolidation, the more significant the breakout that typically follows.
Reversal patterns form at market tops and bottoms where buying or selling pressure has been exhausted. They signal that the prevailing trend is losing momentum and that a change in direction is likely. Volume behavior is critical here: it typically declines as the pattern forms and surges when price finally breaks.
| Pattern Type | Where It Forms | What It Signals |
|---|---|---|
| Continuation | Mid-trend | Pause before resuming |
| Reversal | At tops or bottoms | Trend changing direction |
Both categories offer defined entry points, measurable targets, and logical stop-loss levels. That structure is what makes pattern recognition a practical tool — not a shortcut, but a framework for reading what price action is actually communicating.
Key Continuation Patterns to Know
Continuation patterns identify low-risk entry opportunities within an existing trend. The market isn't changing course — it's organizing before the next push.
Flags and Pennants
Flags form when price consolidates in a tight channel that slopes against the prevailing trend after a sharp directional move (the "flagpole"). A bullish flag slopes downward after an upward move; a bearish flag slopes upward after a downward move. The two boundaries run parallel.
Pennants are similar but the consolidation forms a small symmetrical triangle as trendlines converge, rather than a parallel channel.
Both share the same structure and rules:
- Preceded by a sharp move on heavy volume
- Volume declines during consolidation
- Volume spikes on breakout in the original trend direction
- Duration: typically 1 to 4 weeks — patterns lasting beyond 12 weeks are better classified as rectangles or triangles
- Price target: measured by the height of the flagpole, projected from the breakout point
- Stop placement: just beyond the far edge of the flag or pennant
Thomas Bulkowski's data puts break-even failure rates for flags at 44–45% and pennants at 54% — these are short-term, high-energy patterns that reward quick confirmation and tight risk management.
Triangle Patterns
Triangles are among the most frequently occurring formations on stock charts. There are three types:
- Ascending triangle — flat upper resistance + rising lower support; bullish bias. Bulkowski found upward breakouts occur 63% of the time and meet their targets 70% of the time across more than 1,400 trades
- Descending triangle — flat lower support + falling upper resistance; bearish bias
- Symmetrical triangle — both lines converge toward a point; direction is neutral until the breakout occurs (making it a bilateral pattern)
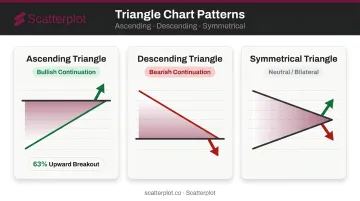
The ideal breakout window is between one-half and three-quarters of the distance to the apex. Waiting too long lets price drift into the apex without momentum; acting too early increases false-breakout risk.
Triangles are particularly useful for advisers because the geometry is clear: the base of the triangle establishes the price target when projected from the breakout, and the opposite trendline provides a logical stop level.
Cup and Handle
The cup and handle is a bullish continuation pattern most associated with William O'Neil's How to Make Money in Stocks. The structure:
- Cup: a rounded U-shaped consolidation (not a sharp V) that forms after an uptrend, reflecting gradual accumulation
- Handle: a short, mild pullback on the right side — typically a small flag or pennant forming in the upper half of the cup
- Breakout: price clears handle resistance, ideally on rising volume
The cup can take 7 to 65 weeks to form on daily charts, with 3 to 6 months being typical. That makes it especially relevant for advisers tracking intermediate to longer-term trend resumptions rather than short-term trades.
Bulkowski's data across 913 trades shows a 5% break-even failure rate and 54% average rise after a confirmed breakout — some of the strongest statistics in pattern analysis. Nvidia's setup before its 43% surge is a frequently cited recent example.
Price target: measure the depth of the cup from base to rim, then project that distance upward from the breakout point.
Key Reversal Patterns to Know
Reversal patterns provide an early warning that a dominant trend is running out of steam. For advisers, they're the signals that prompt a reassessment of current positioning.
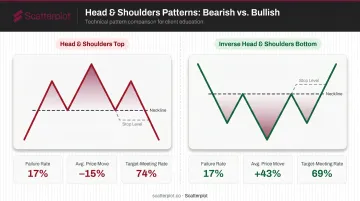
Head and Shoulders
The head and shoulders top is one of the most studied patterns in technical analysis. The structure:
- Three peaks: the middle peak (head) is the highest, flanked by two lower peaks (shoulders)
- Neckline: connects the troughs between the peaks
- Confirmation: price breaks and closes below the neckline on elevated selling volume
The inverse head and shoulders is the mirror image — a bullish reversal forming at market bottoms after a downtrend.
Using the pattern:
- Price target: measure the vertical distance from the head to the neckline, project that distance downward from the neckline break
- Stop placement: just above the right shoulder high
- Neckline retest: common after the break — often offers a second, lower-risk entry opportunity
Bulkowski's data across more than 2,800 head-and-shoulders top trades shows a 19% break-even failure rate, 16% average decline, and 51% target-meeting rate. The inverse version (bottoms) performs better: 11% failure rate, 45% average rise, 71% target-meeting rate across 3,197 trades.
Double Top and Double Bottom
Both patterns share the same underlying logic: two failed attempts at a price extreme signal that momentum is spent.
- Double top (M-shaped): forms after an uptrend when price twice fails to break through the same resistance level, confirming that buying pressure is exhausted
- Double bottom (W-shaped): forms after a downtrend when price twice holds the same support level, confirming that selling pressure has run out
Confirmation and targeting:
- Pattern is confirmed only when price breaks the neckline — the support between two tops, or resistance between two bottoms — on elevated volume
- Price target: height from neckline to tops/bottoms, projected from the breakout
- Entering before neckline confirmation is a frequent and expensive mistake
Bulkowski's Adam & Adam double-bottom data shows a 16% break-even failure rate and 73% target-meeting rate across 1,154 trades. StockCharts recommends additional confirmation filters: a 3% price break or three-day close beyond the neckline before acting.
How to Apply Chart Patterns Effectively
Identifying a pattern is the starting point, not the trade. How you act on it determines whether pattern recognition becomes a repeatable edge.
Confirmation Before Acting
Waiting one to two sessions after a breakout to see if price follows through costs a few points of potential profit but meaningfully cuts exposure to false breakouts — particularly common in low-volume conditions. StockCharts recommends similar filters for double tops and bottoms: a 3% price break or a three-day confirmation window before considering the pattern confirmed.
Volume as the Primary Validator
Bulkowski's research across 15,444 chart patterns found that selecting patterns with a rising volume trend over the three weeks before breakout reduced failure rates by 31%. Three volume principles apply consistently:
- Volume should decline during pattern formation (consolidation phase)
- Volume should expand meaningfully on the breakout session
- A breakout without volume expansion is a warning, not a signal
Stop-Loss and Target Discipline
Define both the stop and the target before entering any pattern-based trade. That discipline is what turns a statistical edge into consistent execution.
- Bullish patterns: stop just below the most recent significant low or the pattern's support line
- Bearish patterns: stop just above the most recent high or the pattern's resistance line
- Targets: calculated from the pattern's measured move (height projected from breakout)
Supporting Indicators
Chart patterns don't need to be used alone. RSI can flag overbought or oversold conditions at pattern completion; moving averages can confirm trend direction; prior support and resistance levels validate whether a breakout is occurring at a meaningful price.
For wealth advisers, communicating these setups to clients requires clear, visual presentation. Platforms like Scatterplot provide daily-updated, branded market visuals with guided talking points — so advisers can walk clients through chart-driven insights without rebuilding decks before every meeting.
Common Mistakes to Avoid
Even valid patterns produce losses when applied carelessly. These are the most frequent errors.
Skipping trend context. A head and shoulders only signals a bearish reversal when it forms after a sustained uptrend. A cup and handle is only a continuation pattern if there's an uptrend to continue. Pattern shapes without trend context are meaningless.
Forcing patterns that aren't there. Pattern recognition is judgment-based, and judgment is vulnerable to confirmation bias — seeing what you want rather than what the chart shows. A valid pattern requires proper proportions, the right number of trendline contact points, and alignment with the broader trend. When the setup isn't clean, waiting for one that is tends to be the better trade.
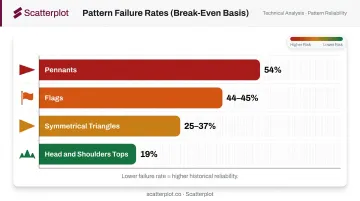
Underestimating failure rates. No pattern is a certainty. Bulkowski's data makes that clear:
- Pennants fail 54% of the time on break-even measures
- Flags fail 44–45%
- Symmetrical triangles fail 25–37%
- Head-and-shoulders tops fail 19%
Defined stops, position sizing, and confirmation discipline are what convert pattern recognition into a sustainable strategy — not a series of educated guesses.
Disclaimer
The content on this site is for informational and educational purposes only and does not constitute financial, investment, legal, or tax advice. It should not be relied upon as the basis for any investment decision. Past performance is not indicative of future results. Always consult a qualified financial professional before making any financial decisions.
Frequently Asked Questions
Do stock market chart patterns really work?
Surveys of professional fund managers show 87% of 692 surveyed use technical analysis to some degree. Most professionals treat patterns as one probabilistic input within a broader framework, combining them with volume confirmation, trend context, and disciplined risk management rather than acting on patterns alone.
What is the most successful stock market chart pattern?
No single pattern is universally the most reliable — performance depends on market conditions, time frame, and execution quality. That said, the cup and handle, head and shoulders bottom, and double bottom are frequently cited for their clearly defined entry and exit rules and relatively favorable success rates when properly confirmed with volume.
What is the 3-5-7 rule in stock trading?
The 3-5-7 rule is a position-sizing framework: risk no more than 3% of capital on any single trade, cap sector exposure at 5%, and keep total portfolio risk below 7%. It's commonly paired with pattern-based strategies so that even a well-formed setup that fails doesn't cause outsized losses.
What are the two main types of stock chart patterns?
Continuation patterns signal that the current trend will pause and then resume (flags, pennants, triangles, and the cup and handle are common examples). Reversal patterns signal that the prevailing trend is ending and price is likely to move in the opposite direction — head and shoulders, double tops, and double bottoms fall into this category.
How do you confirm a chart pattern before acting on it?
Three primary methods: wait for a confirmed close above or below the key breakout level (not just an intraday pierce), verify that volume increases meaningfully on the breakout session, and optionally check a momentum indicator like RSI to confirm conditions support the expected direction of the move.