That's a gap worth closing. For financial professionals, understanding how the circular flow actually works — not just what it looks like — provides a structural framework for interpreting economic data and explaining macroeconomic conditions to clients with genuine clarity.
This article covers what the model is, how its key components interact, what leakages and injections mean for GDP, and why advisers who understand this framework communicate more effectively during periods of market uncertainty.
Key Takeaways
- Money and resources move in a continuous loop between households and businesses through two markets: the product market and the factor market.
- Two flows run simultaneously but in opposite directions: the real flow (goods, labor, resources) and the money flow (wages, spending, revenue).
- Leakages (savings, taxes, imports) drain the circulating flow, while injections (investment, government spending, exports) replenish it.
- Consumer spending accounts for 68.1% of US GDP (Q1 2026), which is why GDP = C + G + I + (X – M).
- For advisers, this model turns isolated data points into a connected economic narrative.
What Is the Circular Flow Diagram?
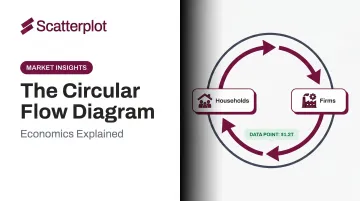
The circular flow diagram is a simplified model used in economics to illustrate how income and expenditure move between the major sectors of an economy in a continuous, self-reinforcing loop. As OpenStax defines it, it shows households and firms interacting through goods-and-services markets and labor markets — each transaction feeding the next.
The model's purpose is practical: it helps economists, policymakers, and analysts understand how a nation's income is generated, distributed, and spent, and how a disruption in one sector ripples outward to others.
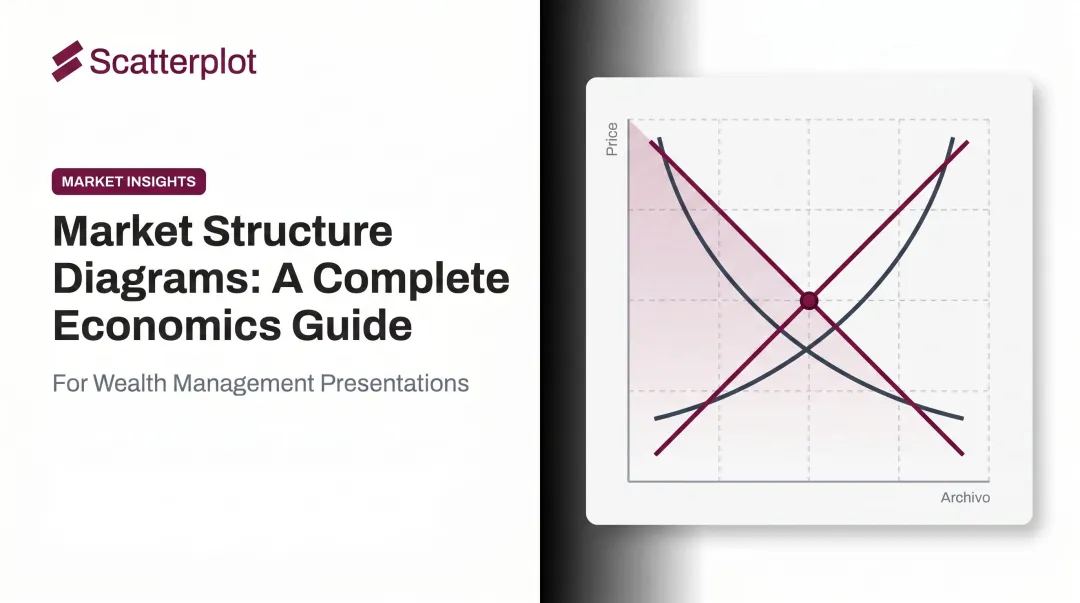
One useful distinction: the circular flow diagram is not the same as a GDP formula or a supply-and-demand model. Each tool does something different:
- Supply-and-demand curve — examines a single market in isolation
- GDP figure — compresses the entire economy into one number
- Circular flow diagram — maps the structural relationships between all major economic actors, showing how they depend on each other in real time
Its origins trace back to 1758, when French economist François Quesnay published his Tableau Économique, drawing explicitly on the metaphor of blood circulating through the human body, as noted by the IMF. The insight was simple and durable: money and resources don't sit still; they circulate.
Key Players and Markets in the Circular Flow Diagram
The Two-Sector Foundation
The basic version of the model involves two actors:
- Households — supply labor and other productive resources; receive income in return
- Businesses (firms) — use those resources to produce goods and services; sell them back to households
These two actors interact through two distinct markets:
- The factor market (also called the resource market) — where labor, land, and capital are exchanged for wages, rent, interest, and profit
- The product market (also called the goods-and-services market) — where finished goods and services are bought by households using the income they earned
"Capital" in the factor market means physical productive assets: machinery, equipment, buildings. The St. Louis Fed is clear on this point — money is not itself a productive resource. For financial advisers, this distinction matters: factor-market capital is not the same as a client's investment portfolio.
Real Flow vs. Money Flow
Two flows run through the diagram simultaneously, moving in opposite directions:
| Flow Type | Direction | What Moves |
|-----------|-----------|------------|
| Real flow | Households → Firms (resources); Firms → Households (goods/services) | Labor, land, capital; finished goods and services |
| Money flow | Firms → Households (income); Households → Firms (spending) | Wages, rent, profit; consumer expenditure |
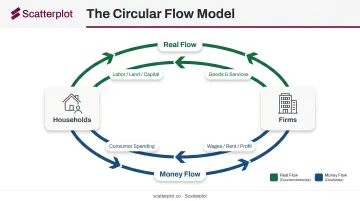
The Federal Reserve Education resource describes this precisely: money flows clockwise while goods, services, and resources flow counter-clockwise. Neither stream functions independently — disrupt one, and the other stalls too.
That two-sector loop captures the core logic cleanly, but it leaves out most of what makes modern economies complicated. Three additions bring the model closer to real-world conditions:
Expanding the Model
- Government sector — collects taxes and spends on public programs (highways, schools, public safety)
- Foreign sector — exports add money into the domestic loop; imports send money out
- Financial sector — savings move out of immediate circulation; lending puts money back in
How the Circular Flow Diagram Works
The model functions as a continuous loop: one actor's spending becomes another actor's income, which cycles back as spending again. The economy sustains itself as long as those flows stay roughly balanced.
The Real Flow: Households to Firms
Households supply the factors of production — labor, land, and physical capital — to businesses through the factor market. Businesses compensate households with wages, rent, interest, and profit. That income becomes the purchasing power households carry into the next stage of the loop.
The Money Flow: Firms to Households and Back
Businesses use those productive inputs to manufacture goods and offer services, which are then sold through the product market. Households spend their factor-market income on those goods and services, returning revenue to businesses. That revenue funds more production, higher wages, and expanded hiring — and the cycle continues.
Government, Foreign, and Financial Sectors
Each additional sector modifies the basic loop in a specific way:
- Government collects taxes (money exits the loop) and spends on public programs (money re-enters)
- Foreign buyers purchase exports (money enters the domestic economy) while households buy imports (money exits)
- Banks collect savings (money temporarily exits) and lend for investment (money returns)
The key insight is that none of these flows are truly independent. A change in household spending behavior — say, a shift toward saving — reduces business revenue, which reduces wages, which reduces household income. The entire loop contracts — which is why tracking interconnected flows, not isolated indicators, gives a clearer picture of economic health.
Leakages, Injections, and What the Model Doesn't Capture
Leakages and Injections
Not all money stays in continuous circulation. The model distinguishes between:
Leakages — money that exits the immediate domestic spending loop:
- Savings (S)
- Taxes (T)
- Imports (M)
Injections — money that re-enters the loop from outside:
- Investment (I)
- Government spending (G)
- Exports (X)
When injections exceed leakages, the flow of money through the economy expands — and output grows. When leakages dominate, the flow contracts.
The GDP Connection
This dynamic maps directly to how GDP is measured. According to the Bureau of Economic Analysis, GDP equals the sum of personal consumption expenditures, gross private domestic investment, net exports, and government consumption expenditures and gross investment:
GDP = C + G + I + (X – M)
As of Q1 2026, US nominal GDP stands at $31.8 trillion (seasonally adjusted annual rate). Breaking down the components:
| Component | Q1 2026 Share |
|---|---|
| Personal consumption (C) | 68.1% |
| Gross private investment (I) | 17.7% |
| Government spending (G) | 17.0% |
| Net exports (X – M) | -2.8% |
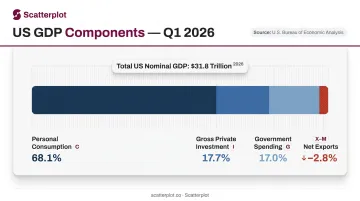
Consumer spending — the most direct expression of household behavior in the circular flow — drives more than two-thirds of US economic output. Household confidence and spending data move markets for exactly this reason.
What the Model Leaves Out
The circular flow diagram maps exchanges well. It doesn't capture everything:
- Informal economies: unrecorded transactions — cash work, barter, household labor — are invisible to the model
- Environmental costs: resource depletion and pollution impose real costs that never appear in the standard flows
- Inequality: aggregate numbers can mask wide disparities in how income actually distributes across households
As the OECD notes, GDP — and by extension, the circular flow — fails to capture who benefits from growth or what's needed to sustain future well-being. The model is a useful accounting tool; it was never designed to answer those broader questions.
What the Circular Flow Diagram Means for Financial Professionals
A Framework for Reading Economic Data
Wealth managers and financial advisers encounter macroeconomic data constantly — GDP reports, consumer spending figures, trade balances, unemployment numbers. The circular flow diagram gives those data points structural context. Rather than tracking each indicator in isolation, advisers who understand the model can see how they connect.
When GDP slows, the mechanism is traceable: reduced household spending flows through to lower business revenue, which feeds back into reduced hiring and lower wages in the factor market — which then constrains household spending further. The diagram makes that causal chain explicit, which is more useful than watching indicators move without understanding why.
The CFP Board's 2021 Principal Knowledge Topics explicitly includes economic concepts, market cycles, and client communication as core competencies. Understanding the circular flow isn't academic extra credit — it's part of the professional baseline.
Communicating Through Uncertainty
According to The American College's research on advising through market uncertainty, most advisers report that client inquiries increase and conversation topics shift during periods of market stress. That's precisely when a clear macro framework matters most.
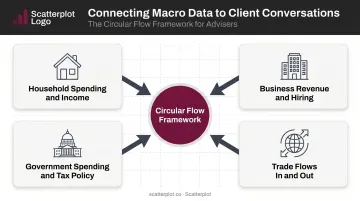
Many advisers are fluent in portfolio-level data but less comfortable explaining the structural mechanics of the economy to clients. The circular flow diagram addresses that directly. Rather than presenting GDP as an abstract number, an adviser can trace it back through concepts clients already recognize:
- Household spending and income
- Business revenue and hiring decisions
- Government spending and tax policy
- Trade flows in and out of the economy
Platforms like Scatterplot provide daily-updated economic and market visuals that advisers can use to bring these dynamics into actual client presentations — pairing economic concepts with clean, branded charts and guided talking points. The goal is to give clients enough context to understand why conditions are changing — not just that they are.
Disclaimer
The content on this site is for informational and educational purposes only and does not constitute financial, investment, legal, or tax advice. It should not be relied upon as the basis for any investment decision. Past performance is not indicative of future results. Always consult a qualified financial professional before making any financial decisions.
Frequently Asked Questions
What is the circular flow chart in economics?
The circular flow chart is a visual model showing how money, goods, and resources move in a continuous loop between households, businesses, and other economic sectors. It's used to understand how national income is generated, distributed, and spent — and how disruptions in one part of the economy affect the rest.
What is an example of circular flow in economics?
A worker earns wages from an employer through the factor market, then spends that income at a grocery store through the product market. The store uses that revenue to pay its own employees — who then spend their wages elsewhere.
What are the two main markets in the circular flow diagram?
The product market, where households buy finished goods and services from businesses, and the factor market, where businesses hire labor and other productive resources from households.
What are leakages and injections in the circular flow model?
Leakages — savings, taxes, and imports — reduce the amount of money actively circulating in the domestic economy. Injections — investment, government spending, and exports — add money back in. When injections outpace leakages, economic output expands; when leakages dominate, it contracts.
How does the circular flow diagram relate to GDP?
GDP measures the total value of goods and services produced in an economy, calculated as C + G + I + (X – M). Each component maps directly to a spending flow in the circular flow model: consumer spending, government expenditure, private investment, and net trade activity.
What is the difference between real flow and money flow?
Money flow refers to financial payments moving between sectors — wages, spending, revenue. Real flow refers to the physical movement of resources and goods — labor going to firms, finished products going to households.