Introduction
Every client meeting carries an unspoken expectation: your advisor has been watching the markets so you don't have to. But for the advisor sitting across the table, that expectation comes with a real cost: hours spent sourcing data, interpreting economic releases, and assembling presentation materials before a single conversation takes place.
The challenge isn't a lack of information. Financial professionals are buried in it. The real problem is converting a flood of market data into clear, client-ready talking points that clients can actually act on.
This post breaks down what market insights advisors should be tracking, where to source them reliably, and how to translate data into client conversations that build lasting trust — covering everything from quarterly review prep to navigating volatile stretches in real time.
Key Takeaways
- Clients expect real-time market context, not just quarterly recaps — proactive communication directly affects retention.
- Track five core categories: equity markets, macro indicators, fixed income and rates, geopolitical/policy developments, and sector themes.
- Build a layered sourcing system using institutional research, official data platforms, and purpose-built advisor tools.
- Presenting data in a clear, branded, visually compelling format is what drives client confidence and sets advisors apart.
Why Market Insights Matter More Than Ever for Advisors
Today's wealth management clients arrive at meetings having already read the headlines. They've checked their brokerage apps, seen the Fed commentary on financial news, and formed opinions. What they want from their advisor isn't a data recitation — it's context, reassurance, and a clear connection to their own financial plan.
The stakes for staying current are measurable. According to Cerulli, close to 40% of retail investors said it is extremely important that their advisor maintains an appropriate amount of contact. The emphasis isn't on how often advisors reach out, but on whether they're present and prepared when markets move.
The Retention Risk Is Real
The cost of falling short is client loss. Research tells a pointed story:
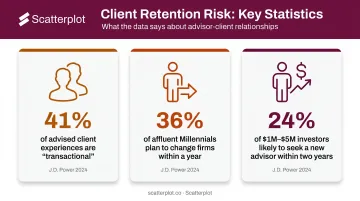
- J.D. Power's 2024 Full-Service Investor Satisfaction Study found 41% of advised client experiences fell into the "transactional" category — relationships where clients don't feel genuine advisory value beyond account management.
- 36% of affluent Millennials with over $1M in investable assets said they "probably" or "definitely" plan to change firms within the year, according to the same study.
- Kitces Research analysis of investors with $1M–$5M found 24% were likely or very likely to seek a new advisor within two years — with recession-induced portfolio losses cited as a top trigger for reconsideration.
Volatility Amplifies Everything
Market downturns don't just test portfolios — they test relationships. Vanguard reported that U.S. equities have been in correction territory approximately 30% of the time between January 1980 and March 2025. Volatility isn't the exception — it's a recurring feature of the advisor's job.
Advisors who communicate proactively during market stress — with clear visuals, grounded context, and a steady perspective — don't just retain clients. They become the advisor clients call first, not the one they eventually replace.
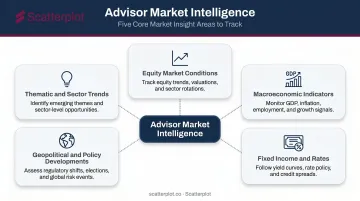
Key Market Insight Categories Every Advisor Should Monitor
Rather than scanning every financial headline, advisors benefit from tracking a structured set of categories that map directly to client concerns. Here are the five that matter most.
Equity Market Conditions
Track major index performance (S&P 500, Nasdaq, Russell 2000), sector rotation patterns, P/E valuations, and earnings season results. Most client portfolios carry meaningful equity exposure, and clients often anchor their emotional read of "how things are going" to index moves. Having specific context — not just "markets were down" — gives advisors something concrete to offer beyond a summary of headlines.
Macroeconomic Indicators
GDP growth, unemployment data, CPI/PCE inflation readings, and consumer sentiment form the economic backdrop that drives long-term positioning conversations. These indicators don't just signal where the economy is. They also frame why the Fed is behaving as it is, and why that matters to a client's bond allocation or retirement timeline.
Fixed Income and Interest Rate Environment
The rate environment affects far more than bond portfolios. Advisors should monitor:
- Federal Reserve FOMC decisions and forward guidance
- Treasury yield curve shape and movements
- Credit spreads across investment-grade and high-yield markets
When clients ask why their bond fund lost value when rates rose, or whether to extend duration now, these are the inputs that make a credible answer possible.
Geopolitical and Policy Developments
Trade policy shifts, fiscal legislation, and geopolitical shocks increasingly move markets in ways that prompt client questions within hours. Advisors don't need to be geopolitical analysts, but a working awareness of these forces lets you contextualize short-term volatility without dismissing it or amplifying client anxiety.
Thematic and Sector Trends
Clients who follow financial media arrive with questions about AI, energy transition, and healthcare innovation. Advisors who track these themes can connect them back to portfolio positioning rather than simply validating or dismissing the latest headline. That's what moves a conversation from reactive reassurance to genuine guidance.
How Financial Advisors Can Source Reliable Market Intelligence
The problem isn't scarcity of market information — it's the opposite. Building a disciplined, time-efficient sourcing system is what separates advisors who are genuinely prepared from those who are just well-read.
Tier 1: Institutional Research
These sources provide data-backed analysis you can cite with credibility in client conversations:
- J.P. Morgan's Guide to the Markets — Comprehensive charts covering market history, valuations, and economic trends, updated regularly
- BlackRock Investment Institute — Weekly market commentary and forward-looking investment views
- Federal Reserve publications — FOMC statements, meeting minutes, and the Beige Book for economic conditions
Tier 2: Official Economic Data
For macro indicators, go to primary sources:
- FRED (Federal Reserve Bank of St. Louis) — The most comprehensive public database for U.S. economic and financial data
- Bureau of Labor Statistics — Employment Situation reports and CPI releases
- Bureau of Economic Analysis — GDP and PCE inflation data
Tier 3: Purpose-Built Advisor Platforms
Even advisors with access to excellent research face a bottleneck: turning raw data into presentation-ready visuals takes time that competes with client-facing work. Cerulli data summarized by NAPA found independent RIAs spend **16% of their time on investment research** — on top of nearly 22% on administrative tasks.
Platforms built specifically for advisors close that gap. Scatterplot, for example, gives advisors access to a library of daily-updated investment visuals covering markets and the economy, with each slide branded to their logo, colors, and compliance disclosures.
Key features that support client-ready prep:
- Daily-updated charts on markets and the economy, ready to present without reformatting
- Guided talking points tied to each slide for actual client conversations
- Full branding customization including logo, color scheme, and disclosures
- Subscription access at $99/month with a 7-day free trial
Translating Market Data Into Confident Client Conversations
Raw data doesn't automatically become client communication. An index dropping 4% means something very different to a 35-year-old accumulating wealth than it does to a 68-year-old two years into retirement. The advisor's job is that translation.
The "So What?" Framework
For every market development worth discussing, work through three questions:
- What happened? — Describe the event simply and accurately
- Why does it matter? — Connect it to broader economic context or portfolio behavior
- What, if anything, should my client consider? — Tie it to their specific goals, risk tolerance, and plan
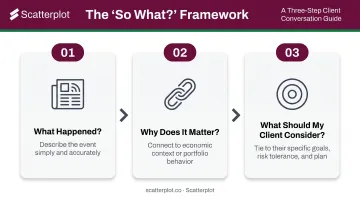
This structure keeps conversations goal-focused and prevents the meeting from becoming a market briefing that leaves clients confused about what to actually do.
The Role of Visual Storytelling
Kitces research found that financial planning visualizations can clarify complex information and generate better client conversations. Charts don't just make data prettier — they reduce the cognitive load required to absorb it.
An advisor who shows a client a 40-year chart of market corrections alongside long-term recovery patterns delivers a more persuasive case for staying invested than any verbal explanation could. Scatterplot is designed with this in mind — its slide library pairs market visuals with guided talking points, so advisors arrive at every client meeting ready to walk through the data, not just display it.
That matters beyond the meeting room too. J.D. Power found that 86% of advised clients logged into their firm's website and 60% used a mobile app in the past 12 months. Visual, digestible market content doesn't just work in meetings — it works across all the digital touchpoints where clients are already engaging.
Common Mistakes Advisors Make With Market Insights
Reacting Instead of Anticipating
Waiting for clients to call during a market event means the advisor is always playing defense. Proactive outreach — a brief market note ahead of a Fed decision, or a summary after a jobs report — signals that you're watching on their behalf. Advisors who communicate first build the kind of trust that's hard to displace.
Overloading Clients With Data
More information isn't more value. Sharing every relevant data point in a client email creates confusion rather than clarity. Identify the two or three most relevant insights for a given client segment and present them in plain language. Knowing what to leave out is just as important as knowing what to include.
Using Generic, Unbranded Content
Sharing visuals sourced from public financial websites — without your firm's identity attached — trains clients to associate that intelligence with the source, not with you. Every piece of market communication should carry your brand, reinforcing that the insight is coming from your practice. Tools like Scatterplot address this directly — logos, colors, and compliance disclosures applied consistently across every slide, without manual design work required.
Disclaimer
The content on this site is for informational and educational purposes only and does not constitute financial, investment, legal, or tax advice. It should not be relied upon as the basis for any investment decision. Past performance is not indicative of future results. Always consult a qualified financial professional before making any financial decisions.
Frequently Asked Questions
How can financial advisors get market insights?
Advisors should build a layered sourcing system: institutional research from major asset managers (J.P. Morgan, BlackRock), official government data platforms (FRED, BLS, BEA), and purpose-built tools that deliver pre-formatted, daily-updated market visuals. This combination provides both depth and efficiency.
What types of market data should financial advisors track?
The five core categories are equity market conditions, macroeconomic indicators, fixed income and interest rate trends, geopolitical and policy developments, and sector or thematic trends. Together, these cover the most common client questions and portfolio positioning decisions.
How often should financial advisors review market analysis?
Daily awareness of major market-moving events is valuable, particularly around scheduled releases like Fed decisions, jobs reports, and earnings. Deeper analytical review can be weekly, with a fuller synthesis ahead of client meetings or quarterly reviews.
How do you explain market volatility to clients?
Frame volatility in terms of long-term financial goals, not short-term index moves. Historical context — showing clients how markets have behaved through prior corrections — normalizes uncertainty without dismissing it. Clear visual data makes that case far more effectively than numbers alone.
What is the best way to present market insights to clients?
Lead with visuals rather than raw statistics, and anchor every data point to the client's specific goals. Branded presentation materials reinforce your credibility throughout the conversation, while structured talking points keep your narrative on track. The data supports you — not the other way around.
How much time do advisors spend preparing market updates?
Independent RIAs spend approximately 16% of their time on investment research, according to Cerulli data. Kitces benchmarks put investment-management tasks at around 5.5 hours per week. Platforms like Scatterplot cut that prep time by delivering client-ready visuals — no manual chart-building required.