This post breaks down what that chart actually means, how today's concentration compares to prior historical peaks, what the real risks are, and how to use this insight to lead more confident client conversations. It's written for wealth managers and financial advisers who need a clear command of the topic before their next review meeting.
Key Takeaways
- The top 10 S&P 500 stocks held ~38–40% of total market cap by early 2026 — surpassing the Dot-Com peak concentration level
- Prior concentration peaks (Nifty Fifty, Dot-Com) each unwound the same way: the largest stocks significantly underperformed in the years that followed
- Today's mega-caps have real earnings, but their market cap weight now exceeds their earnings share — a gap that signals stretched valuations
- When top-10 concentration has reached 30%+, the broader market outperformed the largest stocks in 84% of subsequent five-year periods
- Advisers who address concentration risk directly — with clear data — are better positioned to retain clients through a potential unwind
What Is US Stock Market Concentration?
Market concentration measures how much of an index's total value sits in a small number of companies. In a cap-weighted index like the S&P 500, larger companies automatically receive larger weights — so as winners grow, their share of the index grows with them. Concentration isn't a flaw in the system; it's a structural feature of how these indices work. What matters is the degree — and right now, that degree has reached historically extreme levels.
According to J.P. Morgan Asset Management's Guide to the Markets, the top 10 S&P 500 companies accounted for 37.9% of total market capitalization as of March 31, 2026. Year-end 2025 figures from multiple sources clustered near or above 40%:
| Source | Date | Top-10 Weight |
|---|---|---|
| RBC Wealth Management | End-2025 | 40.7% |
| Hartford Funds | Dec. 31, 2025 | 39.7% |
| D.E. Shaw | Dec. 31, 2025 | 40%+ |
| J.P. Morgan Asset Management | Mar. 31, 2026 | 37.9% |
For context, the Dot-Com peak sits at roughly 27–33% depending on the source. Today's level exceeds it under any reasonable comparison.
That concentration is largely driven by the "Magnificent Seven" — Apple, Microsoft, Nvidia, Alphabet, Amazon, Meta, and Tesla — plus a handful of other mega-caps rounding out the top 10. For advisers, this matters because millions of passive index fund investors carry heavy exposure to these same names, often without a clear picture of just how concentrated that bet has become.
A Historical Pattern: This Isn't the First Time
High concentration is a recurring feature of market cycles, not an anomaly. Two prior episodes are the clearest parallels to today.
The Nifty Fifty Era (Late 1960s–1974)
A concentrated group of blue-chip industrial and consumer giants dominated the market in the late 1960s and early 1970s, commanding premium valuations based on their perceived quality and growth. The unwinding was severe. According to Bridgeway Capital Management, the S&P 500 fell over 14% in 1973 and over 26% in 1974, while Nifty Fifty stocks fell over 19% and then 38%, delivering five-year average returns of -4.4%. The broader market's losses were cushioned by the other 490+ stocks.
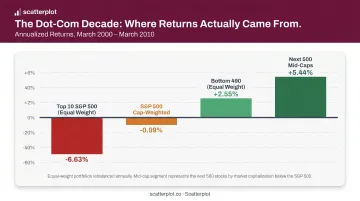
The Dot-Com Peak (2000–2010)
Technology and growth companies drove top-10 S&P 500 weight to multi-decade highs around 2000. The subsequent decade is the strongest documented case for concentration risk. CFA Institute research shows annualized returns from March 2000 to March 2010:
| Portfolio | Annualized Return |
|---|---|
| Top 10 (equal weight) | -6.63% |
| S&P 500 (cap weighted) | -0.99% |
| Bottom 490 (equal weight) | +2.55% |
| Next 500 mid-caps | +5.44% |
The same source shows the 1964–1974 episode produced -0.44% annualized for the top 10 versus +3.09% for the bottom 490.
These return gaps become more striking when you factor in how quickly market leaders turn over. IBM and GE topped the rankings in 1985; Nvidia, Apple, Microsoft, and Amazon lead today. Hartford Funds notes that placement in the top 10 is historically "short-lived" — today's leaders are not guaranteed to hold their positions.
What's Fueling Today's Concentration?
Two catalysts have driven today's concentration. The COVID-era shift to remote work and digital commerce disproportionately benefited mega-cap technology companies, pulling forward years of growth into a compressed window. Then the 2023 generative AI boom — triggered by the public release of ChatGPT — created an enormous infrastructure buildout that rewarded the same group of companies again.
Goldman Sachs reports that the largest public hyperscale tech companies spent roughly $400 billion on capital expenditure in 2025, up nearly 70% from 2024. Those same top tech stocks accounted for 53% of the S&P 500's total 2025 return.
Real Fundamentals — But a Growing Gap
Unlike the Dot-Com era, today's concentration has genuine earnings behind it — LSEG data shows Magnificent Seven earnings grew 36.8% in 2024. The question is whether current valuations already price in continued outperformance:
- Growth is expected to moderate to 17.1% in 2025, while the rest of the S&P 500 is projected to grow earnings from 6.9% to 9.2% — a narrowing gap
- The market cap weight of the top 10 (37.9%) now significantly exceeds their share of S&P 500 earnings (33.2%), according to J.P. Morgan — a 4.7 percentage point gap that implies elevated growth expectations are already priced in
On valuations, J.P. Morgan shows the top 10 trading at 23.0x forward P/E versus 18.0x for the remaining S&P 500 companies. Goldman Sachs notes the broader S&P 500 forward P/E sits near 22x, approaching the 24x record reached in 2000.
The Risks Advisers Should Have on Their Radar
Elevated Valuations and the Earnings Gap
When a handful of stocks trade at stretched multiples with aggressive growth expectations already priced in, modest disappointments can trigger outsized price declines. Because these names carry such large index weights, the entire index absorbs the impact. The valuation premium is significant: the top 10 trade at 23x earnings versus 18x for the rest of the index, leaving little margin for error.
That concentration risk extends beyond returns — it reshapes how volatility moves through the market. D.E. Shaw reports that as of December 2025, the top 10 S&P 500 stocks contributed more than 50% of total index volatility, with their aggregate volatility running at 1.5x the volatility of the S&P 500 as a whole. When many investors hold the same mega-cap names, sentiment shifts hit harder and spread faster across the entire index.
Why Diversification Remains the Adviser's Most Important Tool
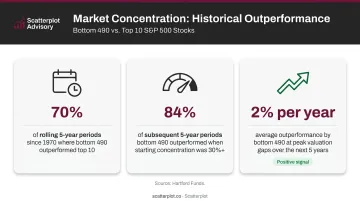
The historical data here is unusually clear. Hartford Funds research shows:
- The bottom 490 stocks outperformed the top 10 in 70% of rolling five-year periods since 1970
- When top-10 concentration started at 30% or above, the bottom 490 outperformed in 84% of subsequent five-year periods
- At peak valuation gaps, the bottom 490 outperformed by an average of 2% per year over the next five years
That data points to a specific adviser action — not abandoning mega-cap exposure, but auditing it. Passive index holdings may have quietly built a concentrated bet into client portfolios: a simple S&P 500 index fund now carries more top-10 concentration than at any point in modern market history.
Diversifying across sectors, geographies, and company sizes is how advisers have historically navigated this kind of concentration risk — and the data above shows why that approach tends to pay off over five-year horizons.
How to Explain Market Concentration to Clients
Most clients respond well when you frame the conversation this way: concentration is normal, today's level is historically unusual, and the right response is awareness, not alarm.
A few practical framing approaches:
- Use a simple line chart showing top-10 weight over time. A long plateau, two prior peaks, and a current spike well above both tells the story immediately — no technical explanation needed
- Anchor to history — the Dot-Com comparison is something most clients have lived through and remember. It makes the current moment feel recognizable, not apocalyptic
- Connect it to their portfolio — when a client realizes their "diversified" index fund holds nearly 40% of its value in 10 companies, the portfolio review conversation follows naturally
- Keep the tone calm and educational — the data is notable, not catastrophic. Advisers who present it that way earn more credibility than those who dismiss it or dramatize it
Scatterplot provides daily-updated market concentration charts with guided talking points built in — so advisers can bring this conversation into any review meeting without sourcing data or building slides from scratch.
Disclaimer
The content on this site is for informational and educational purposes only and does not constitute financial, investment, legal, or tax advice. It should not be relied upon as the basis for any investment decision. Past performance is not indicative of future results. Always consult a qualified financial professional before making any financial decisions.
Frequently Asked Questions
What does US stock market concentration mean?
Market concentration refers to how much of an index's total value is held by a small number of companies. High concentration means a few stocks have outsized influence over overall index performance — so when those names move, the whole index moves with them.
Who owns most of the US stock market?
The Magnificent Seven — Apple, Microsoft, Nvidia, Alphabet, Amazon, Meta, and Tesla — dominate current S&P 500 index weight. Because index funds hold large positions in all seven, millions of passive investors carry significant exposure to them, often without realizing it.
Is high US stock market concentration good or bad?
Today's largest companies have genuine earnings and competitive advantages — concentration alone isn't a red flag. The concern is that elevated concentration has historically preceded higher volatility and underperformance among the top names, which makes intentional diversification more valuable at current levels.
Has the US stock market been this concentrated before?
Concentration is a recurring feature of US market history, appearing notably during the Nifty Fifty era and the Dot-Com bubble. Today's level — near or above 40% for the top 10 — rivals or exceeds both prior peaks, making this a historically notable moment.
What happens to portfolios when market concentration is high?
Passive index fund investors often carry more concentration risk than they realize. Historical data shows that after peak-concentration periods, smaller and mid-cap stocks have tended to outperform the largest names over subsequent five-year periods.
How should advisers explain market concentration to clients?
Use a simple chart showing top-10 weight over time, frame the current moment as historically unusual but not unprecedented, and connect the insight directly to the client's own portfolio. Keep the tone calm and educational — the goal is informed awareness, not alarm.